💧The Inaugural Post
Welcome to Data Drop!
We’ve always been a group of A/B testers here at 9 Clouds. After all, we want to know — based on data — what works best for our clients across all content platforms.
But, with all of us A/B testing different things all the time, it’s often hard to come to cohesive conclusions that would allow us to define “best practices.”
So recently, we’ve honed in on one or two aspects to test — as a group, across several clients — each month. Along with that, we’ll be droppin’ the data on these findings in this new, quarterly blog series — so that you, too, can benefit from our A/B test results.
Thanks to the group tests we’ve done so far, we’ve come to a few conclusions about what works best for our clients’ emails. Here’s what we’ve found makes an impact on two of the most significant metrics for email marketing: open rate and click-through rate (CTR).
😉😜 (Emojis in Subject Line)

Testing Variable
Emoji in the subject line
💧Version A: Includes an emoji [🎈Pop open this email to see what’s new!]
💧Version B: Doesn’t include an emoji [Pop open this email to see what’s new!]
Hypothesis
Version A will have an average higher open rate across the email sends than Version B.
Results
💧 Open rate among 12 emails:
- Version A had an average open rate of 20.81% with a range from 15.26% to 56.97%.
- Version B had an average open rate of 29.01% with a range from 16.08% to 66.09%.
💧 Click-through rate among 12 emails:
- Version A had an average CTR of 13.83% with a range from 2.39% to 46.81%.
- Version B had an average CTR of 14.75% with a range from 1.77% to 54.29%.
Conclusion
While Version A had a higher open rate on seven of 12 emails, the average open rates for Version B were 8.2% higher (and surpassed our internal benchmark). Our team is going to run this group test again to see what happens, but it’s looking like it may be a good idea to forget about emojis in subject lines.
From Whom? (Email Sender Name)

Testing Variable
Email sender name
💧Version A: First Name + Last Name [Jaden Miller]
💧Version B: First Name at Company Name [Jaden at 9 Clouds]
Hypothesis
Version A will have an average higher open rate across the email sends than Version B.
Result
💧 Open rate among 10 emails:
- Version A had an average open rate of 22.83% with a range from 10.57% to 52.63%.
- Version B had an average open rate of 23.13% with a range from 10.08% to 61.33%.
💧 Click-through rate among 10 emails:
- Version A had an average CTR of 11.74% with a range from 5.4% to 19.51%.
- Version B had an average CTR of 14.28% with a range from 6.4% to 27.83%.
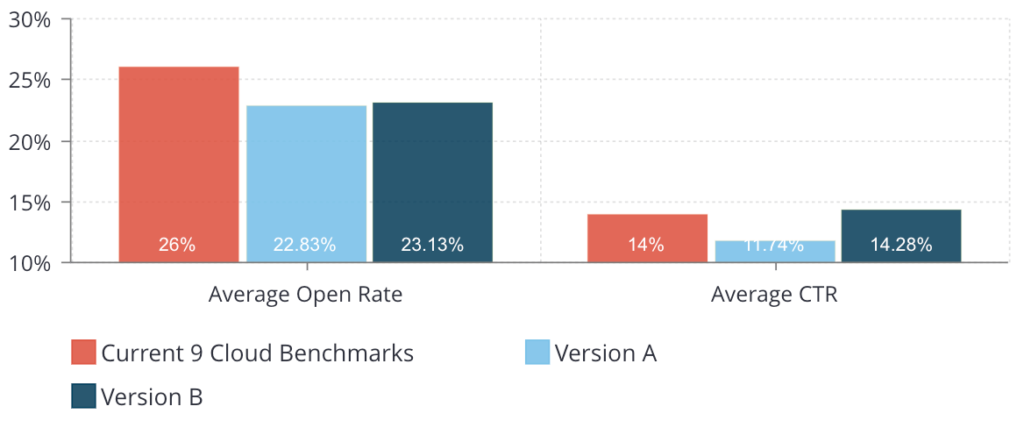
Conclusion
Using Version A versus Version B may not have a significant effect on open rate, but it may help improve CTR (a finding consistent with our previous tests). We’re going to start implementing this across our work.
…To Me! (Personalization in Subject Line)

Testing Variable
Personalization in the subject line
💧Version A: Includes personalization [Name, open this email.]
💧Version B: Doesn’t include personalization [Open this email.]
Hypothesis
Version A will have an average higher open rate across the email sends than Version B.
Result
💧 Open rate among nine emails:
- Version A had an average open rate of 27.28% with a range from 8.68% to 47.54%.
- Version B had an average open rate of 24.94% with a range from 8.25% to 43.99%.
💧 Click-through rate among nine emails:
- Version A had an average CTR of 14.02% with a range from 2.06% to 30%.
- Version B had an average CTR of 15.18% with a range from 1.83% to 31.9%.
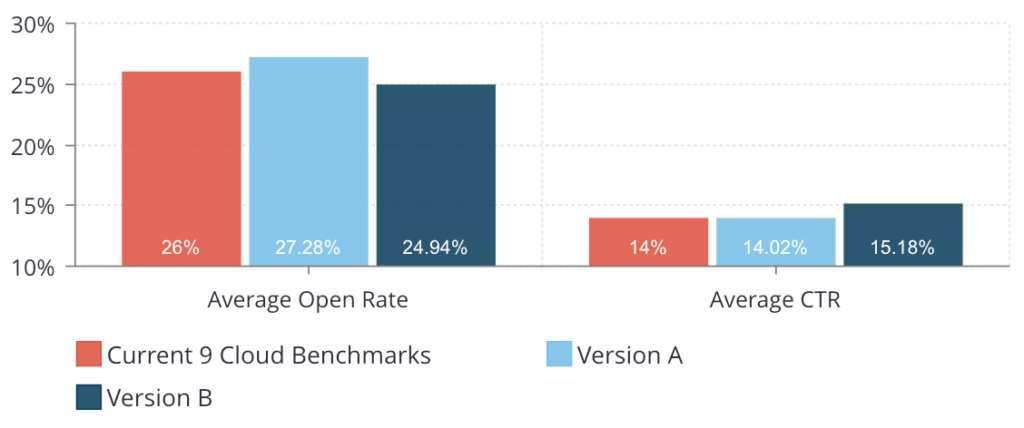
Conclusion
Using personalization in the subject line had a slightly positive effect on open rate (an average of 2.34% higher) and had a higher open rate on eight of nine emails. We’re going stick with including personalization in subject lines and will let you know if we test it again.
Keep Learning with Us!
Our goal in conducting these A/B tests is to see our clients’ email and Facebook benchmarks improve over time by identifying and utilizing best practices.
So, what’s next? We’ll incorporate these findings into our content, continue testing new things, and retest as needed. In next quarter’s Data Drop, you can look forward to some Facebook A/B test findings!
In the meantime, we hope you try out some of these tests on your own email marketing tactics.
Win the Inbox with Email Marketing from 9 Clouds »