
💧We Don’t Need CTA Buttons on Facebook Ads
Through several unanimous A/B tests, we have found that automotive Facebook ads perform better without call-to-action (CTA) buttons and that audiences respond better to the dynamic video option on collection ads vs. a static image.
Automotive marketers and dealership marketing managers know that optimization is key to staying on top of your dealership’s key performance indicators.
As a group of digital marketers, we continually test various aspects of our content. We have refined our A/B testing process over the past few months since we published the first installment of this Data Drop blog series.
Recently, we have focused a lot on the confidence of our test findings with statistical significance (we love using this testing significance calculator!). In doing so, we discovered that our team wasn’t consistently isolating our Facebook ads into their own ad sets for testing purposes — oops! (See rule #6 in this article.)
Still, we came to several interesting conclusions based on the testing data over this past quarter. Here are some highlights of our best practices for Facebook ads, as determined by our recent A/B testing results.

CTA Button in Facebook Ads
Testing Variable
💧Version A: Has a CTA button
💧Version B: Does not have a CTA button
Hypothesis
Our team hypothesized that Version B would have a higher click-through rate (CTR) and lower cost per click (CPC).
Results
💧Click-through rate among 10 Facebook campaigns:
- Version A had an average CTR of 1.25% with a range from 0.46% to 2.69%.
- Version B had an average CTR of 1.6% with a range from 0.41% to 2.56%.
💧Cost per click among 10 Facebook campaigns:
- Version A had an average CPC of $1.03 with a range from $0.30 to $1.62.
- Version B had an average CPC of $0.92 with a range from $0.31 to $1.93.
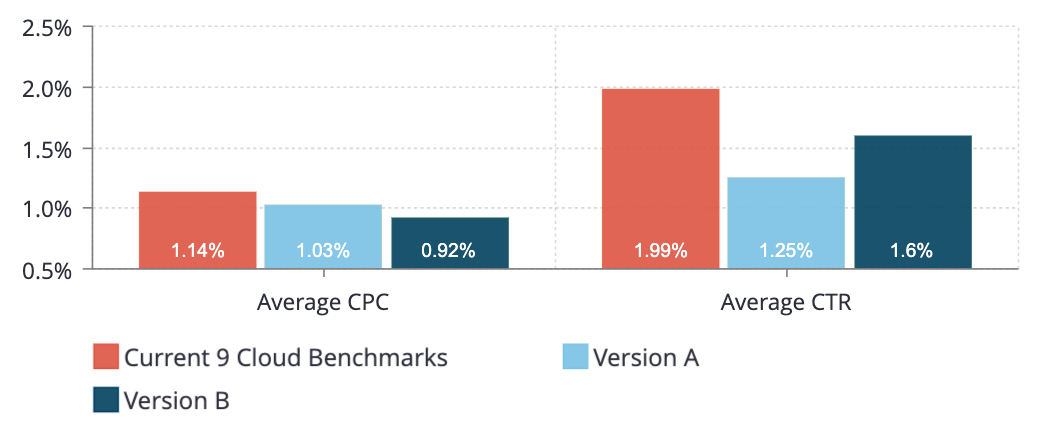
Conclusion
Version B (with no CTA button) resulted in an average increased CTR of 28% than version A and a 12% decrease in CPC. Version B had a higher CTR in 8/10 tests and a lower CPC in 5/10 tests.
None of the tests had a statistical significance of more than 95% (using “unique outbound link clicks” as the conversion metric) — so we aren’t going to claim that it’s better not to include CTA buttons across the board.
However, based on the above CTR and CPC stats of all our tests, our team is erring on the side of not including CTA buttons in Facebook ads.
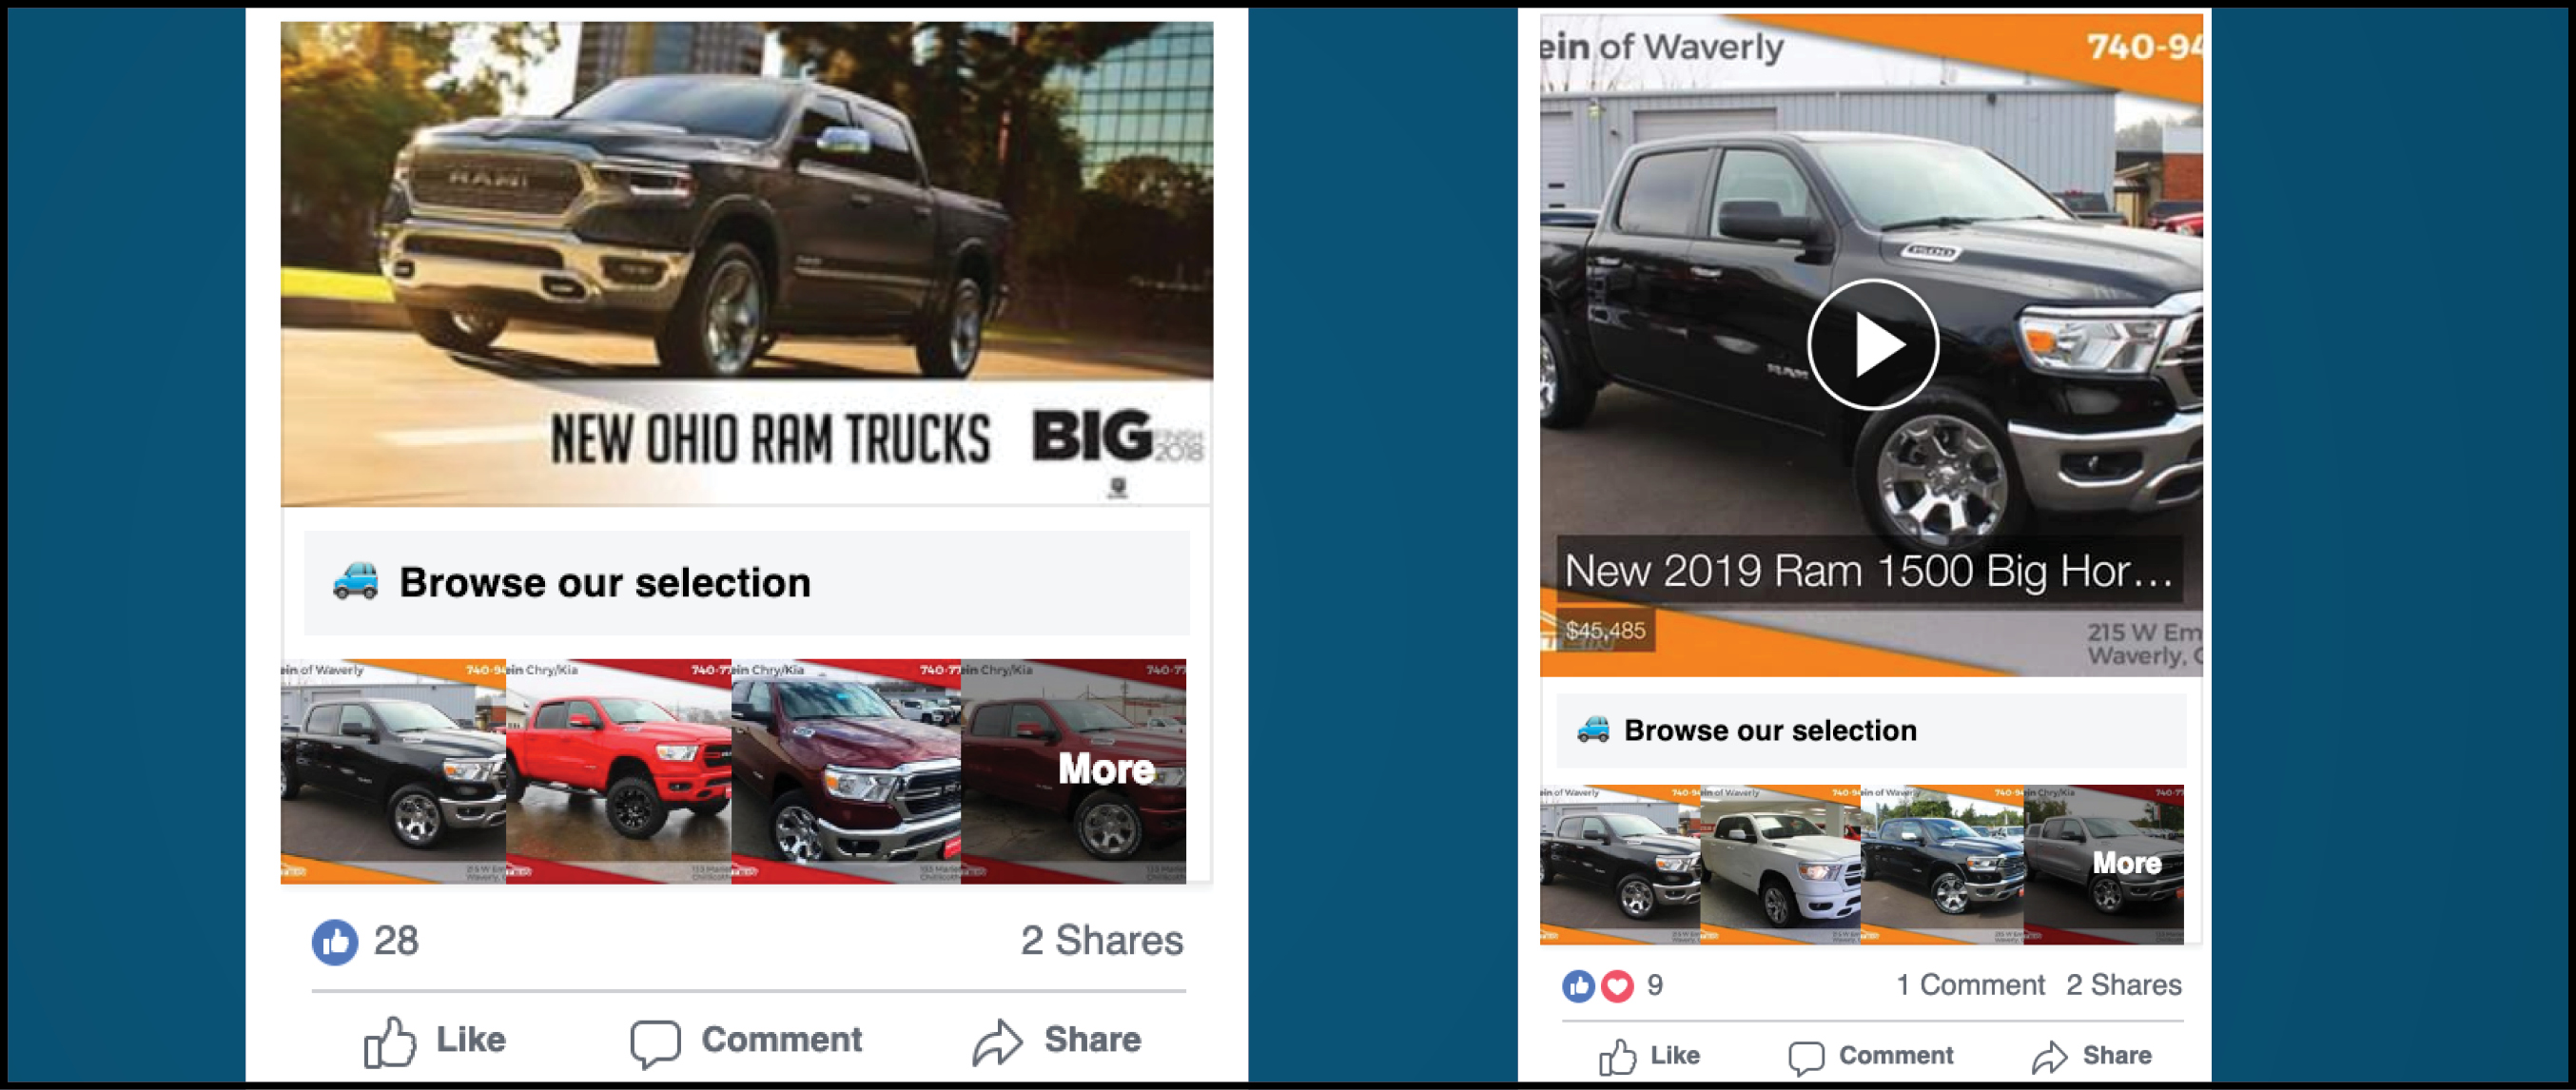
Static Image vs. Dynamic Product Set Video in Facebook Collection Ads
Testing Variable
💧Version A: Collection ad uses a static image
💧Version B: Collection ad uses a dynamic product set video
Hypothesis
Our team hypothesized that Version B would have a higher click-through rate and lower cost per click.
Results
💧Click-through rate among 12 Facebook campaigns:
- Version A had an average CTR of 2.54% with a range from 0.73% to 4.78%.
- Version B had an average CTR of 2.85% with a range from 1.28% to 5.48%.
💧Cost per click among 12 Facebook campaigns:
- Version A had an average CPC of $0.33 with a range from $0.12 to $0.84.
- Version B had an average CPC of $0.29 with a range from $0.10 to $0.68.
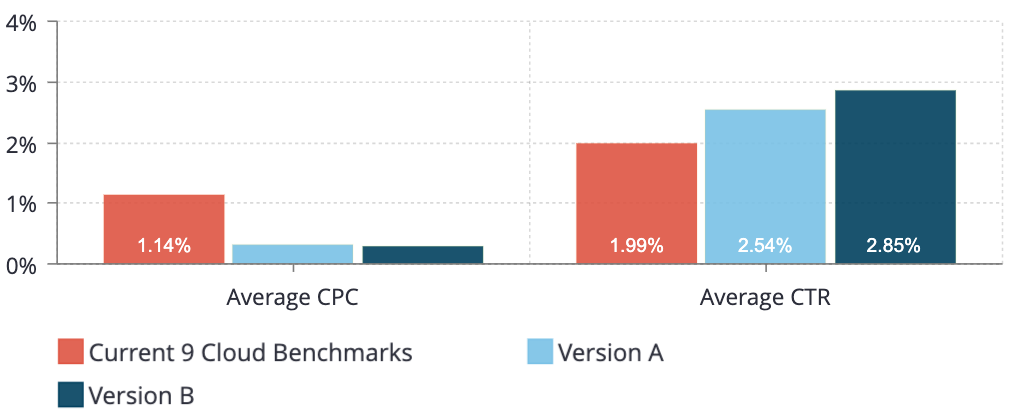
Conclusion
Version B (with the dynamic product set video) resulted in an average increased CTR of 12.2% and a 13.8% decrease in CPC. Version B had a higher CTR in 8/12 tests and a lower CPC in 9/10 tests.
We’ll still use static images on a collection ad in place of a dynamic video at our discretion. But thanks to these tests, we are confident that our Facebook audiences respond well to the dynamic video!

Audience Network Placement in Facebook Ad Sets
Testing Variable
💧Version A: Ad set includes the Audience Network placement
💧Version B: Ad set does not include the Audience Network placement
Hypothesis
Our team hypothesized that Version A would have a higher click-through rate and lower cost-per-click.
Results
💧Click-through rate among 11 Facebook campaigns:
- Version A had an average CTR of 3.05% with a range from 0.60% to 11.47%.
- Version B had an average CTR of 2.88% with a range from 0.56% to 11.12%.
💧Cost per click among 11 Facebook campaigns:
- Version A had an average CPC of $0.90 with a range from $0.07 to $.1.94.
- Version B had an average CPC of $1.13 with a range from $0.08 to $2.66.
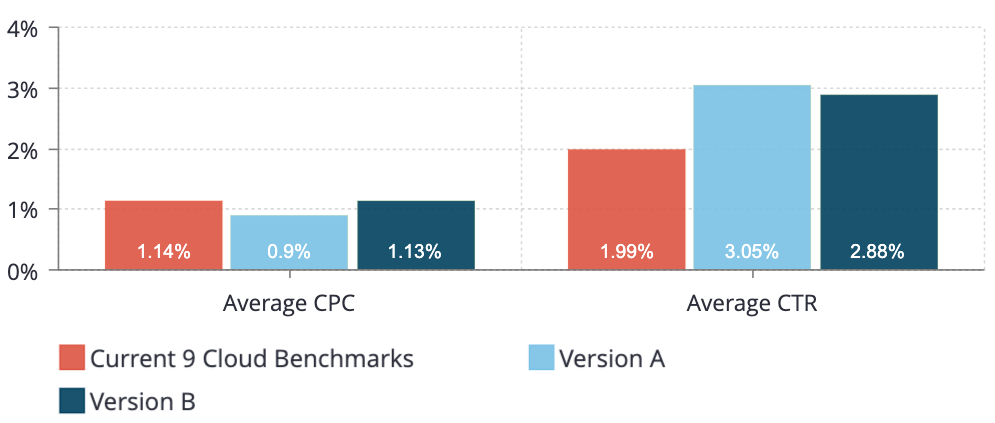
Conclusion
Version A (with the Audience Network placement) resulted in an average increased CTR of 6% and a decreased CPC of 26%. Version A had a higher CTR in 10/11 tests and a lower CPC in 8/11 tests.
Based on this data, our team is confident that including the Audience Network placement in our Facebook ads will likely contribute to a higher CTR and lower CPC.
What Are You A/B Testing?
Our goal in conducting these A/B tests is to see our clients’ email and Facebook benchmarks improve over time by identifying and utilizing best practices.
(“Drop“ by our other Data Drop posts here!)
What have you learned from your own A/B tests? Want help with your testing strategy? If so, watch our content testing webinar.
We’ll see you next quarter with more test results!
Psst . . . Craving More Marketing Data?
Each year we update and release our Automotive Performance Benchmarks Report. If you’ve ever wondered how your digital marketing metrics stack up to others in the auto industry, this report will show you — clearly and scientifically.
Get your free copy of this one-of-a-kind automotive marketing report!