
Measuring SEO Success with Google Analytics for Auto Marketers
A marketing plan won’t be successful without tracking, measuring, and (possibly) altering your course.
If you’re consistently sending messages into the digital universe, how do you tell if your efforts are successful?
Go with your gut? Hopefully not.
Why Google Analytics for Auto Marketers?
My experiences in marketing have shown me how easy it is to get in a rut. You know you’re in a rut when someone asks, “Why do you do thing X?” and the answer is, “Because that’s how we’ve always done it.”
Whoops.
Google Analytics keeps accountability top of mind. You can watch for traffic patterns on your website and establish a baseline to start making changes to it: keeping your content fresh, building strong cornerstone content, and maybe even altering some design.
Google Analytics facilitates smarter, more data-driven decision-making. Less gut.
You’ll find a lot of video tutorials online — like the one below, which is a walkthrough of Google Analytics 4.
Getting Started with Automotive Analytics
Getting Google Analytics set up is the easy part. There’s a decent amount of help available on their site, but it’s a fairly easy process:
- Create an Analytics account here.
- In your new account, set up a property.
- Set up your tracking code.
- Set website goals for your account.
One of my favorite things about Google Analytics is that it’s totally free. The only cost you have to take into consideration is the cost of your time, as there are a lot of great resources available to get lost in.
Google also has an entire YouTube channel devoted to educating you about Google Analytics. Yes — also free.
What to Watch
You could easily spend the rest of your life in Google Analytics for auto marketers. I don’t recommend it unless you’re that special kind of crazy. I’ve regularly found myself down an Analytics rabbit hole and it can be a time suck if you don’t watch yourself!
What you can do though, is get a tried and true list of what to monitor. After you’ve let your Analytics account build up some data, it’s time to analyze.
Beginner Google Analytics Metrics
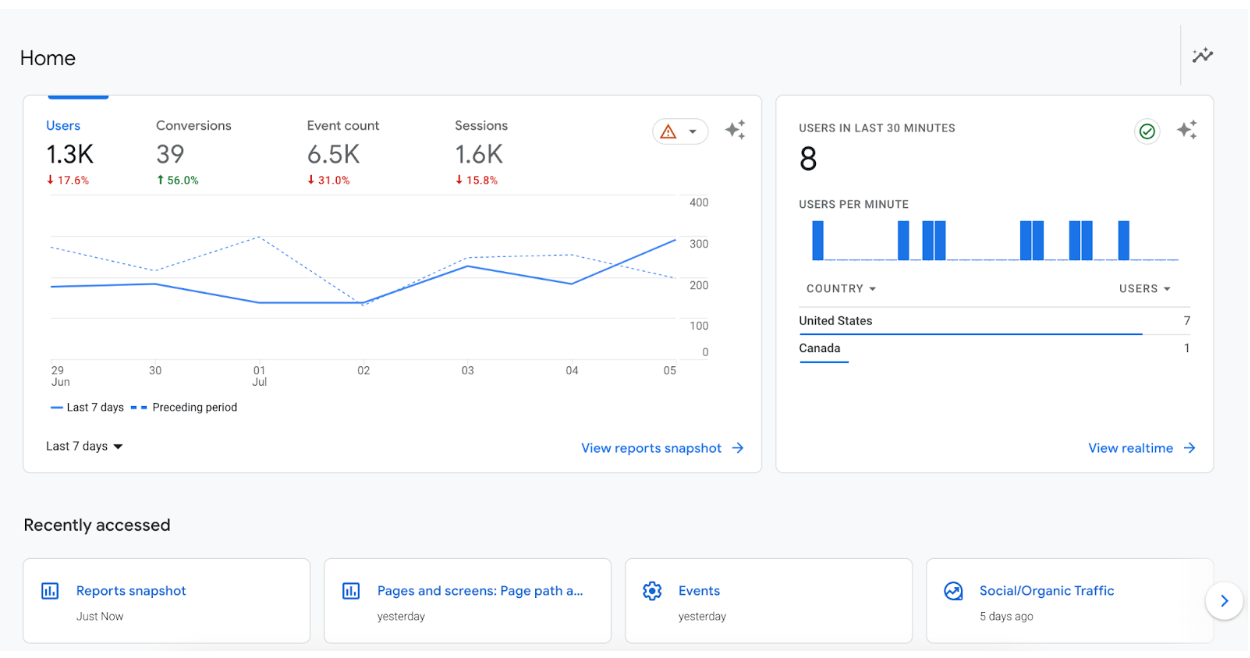
When you’re first starting out in Analytics, it can be overwhelming! To help offset a large amount of data you can sift through, we’ve narrowed it down to a few key metrics that are straightforward and easy to understand.
Where to find this data: Audience >> Overview
- Users: The number of people who viewed your site
- Engaged Sessions: The number of website visits made by users
- Pageviews: The number of website pages they visited
- Avg. Engagement Time: The average time spent by a user on your website
- Bounce Rate: The percentage of visitors who navigated away from your site after viewing only one page
All of these metrics come together in a cohesive fashion and give you an idea of who your audience is, how long they stayed on your site and if they found what they needed. Some questions you can ask from this information.
- How many people are coming to your website and are they coming back more than once?
- How many pages do people look at in any given session?
- Is your content relevant that they are navigating throughout the website?
- Do people stay on the page and read?
- Do they go to more than one page or bounce off that first one?
Pulling these Google Analytics metrics together will help you establish a working baseline and allow you to learn more about your customers — including what their relationships are like with your products.
Intermediate Analytics Metrics
Once you feel comfortable with the basic, but highly important metrics from the section above, we’re sharing a few more places to delve in and learn more about your website visitors.
- Demographics: The age and gender of your users
- Location: The geographic location of where users are (breaks down as small as the city)
- Device: The type of technology users are on (mobile, desktop, tablet)
- Source/Medium: The way people are getting to your site.
We’ll break each of these down so you can understand them better.
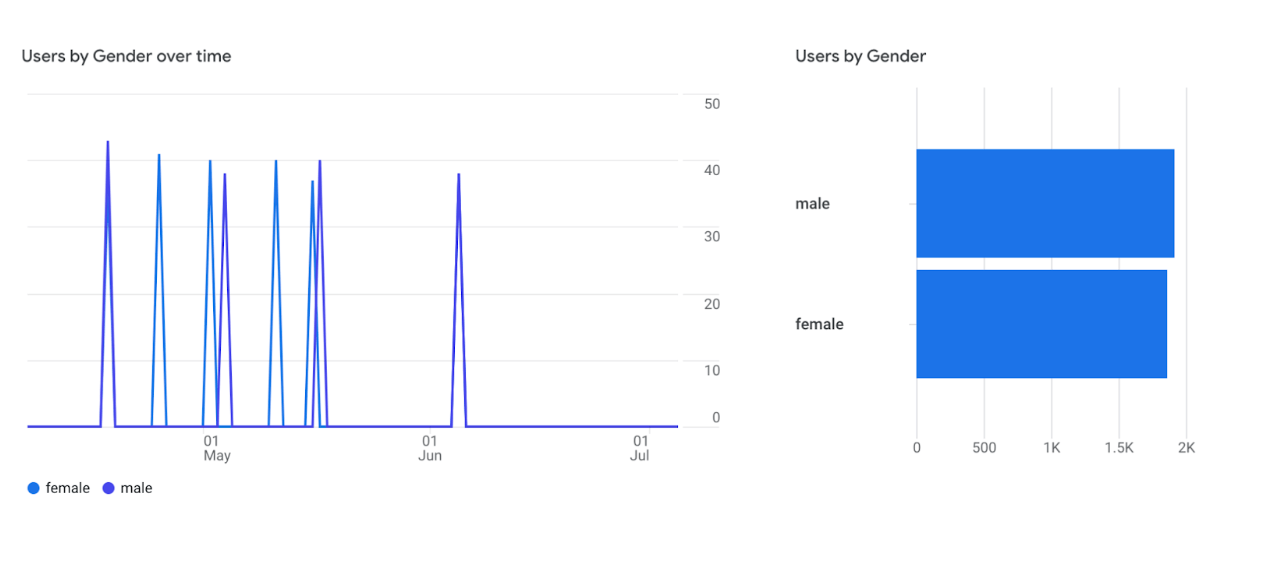
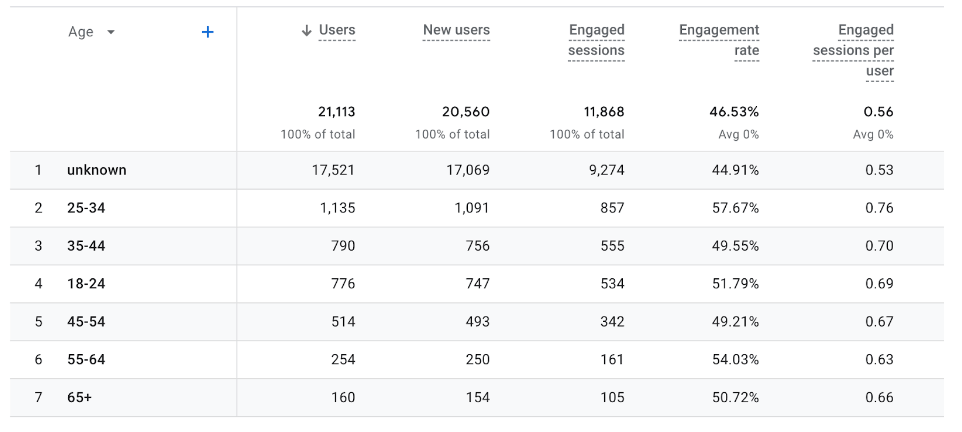
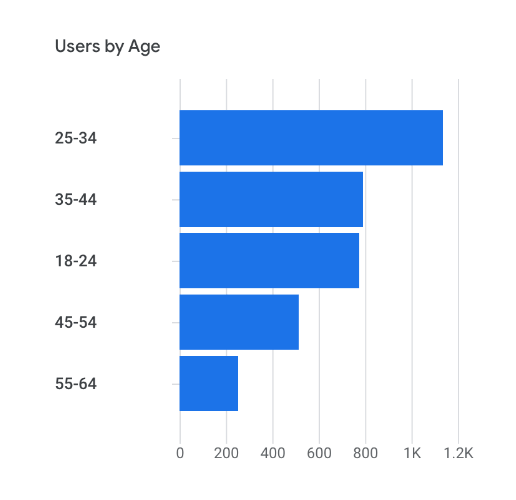
Demographics
Where to find this data: User >> User Attributes >> Demographic Details
If you are in tune with your buyer persona, this data probably won’t surprise you. Check out this section to see if you are targeting the right amount of people who convert on your website.
Google doesn’t know every single detail about people so check the percentage of total users noted in the overview section of Demographics. If it’s low, stick with your sales data if you know age and gender.
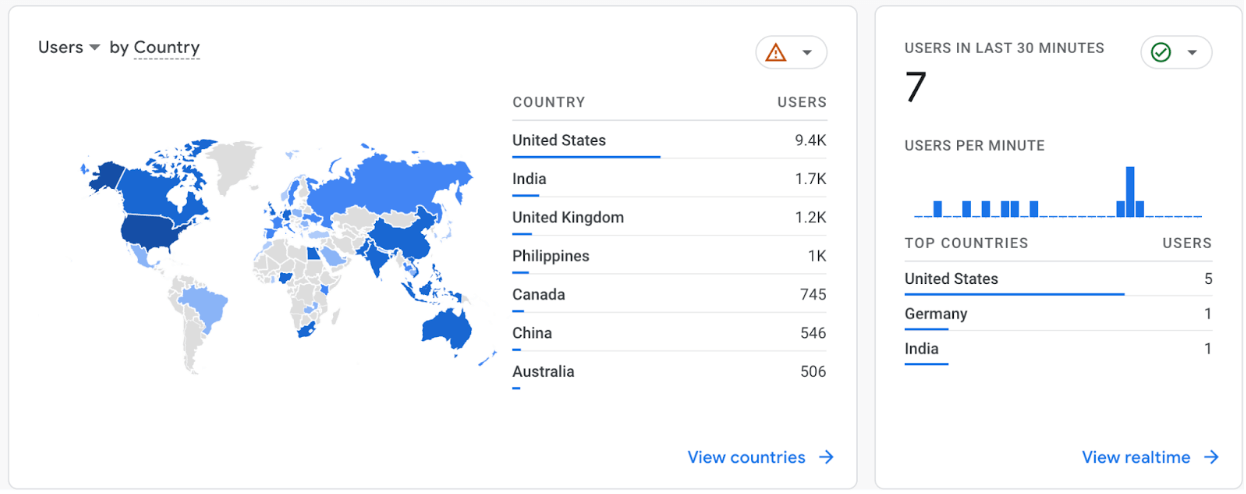
Location
Where to find this data: User >> User Attributes >> Overview
This data shows where your visitors are coming from. You may be surprised to find a close city converts well on your website but you haven’t put any money behind targeting that area. This can help you ramp up paid ads in that area, or vice versa take them out of targeting if they just end up being lookie-loos.
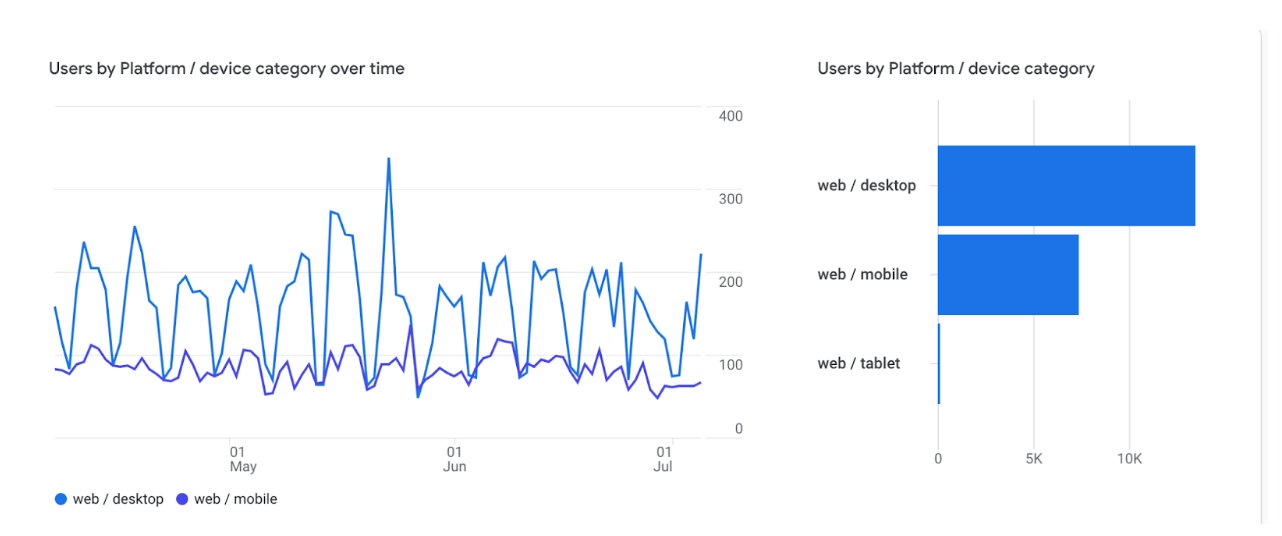
Device
Where to find this data: User >> Tech >> Tech Details
This section is especially important as it can give you insight if something isn’t working overall. Maybe when people are on mobile, your website doesn’t render properly and your bounce rate is super high. It may also show a break in your sales funnel.
Source/Medium
Where to find this data: Acquisition >> Overview >> Traffic Acquisition >> Source/Medium
This is best defined as how people got to your website. A few tips for looking at the data:
- Organic: This is traffic that found you on a search engine and clicked through. (These are not paid ads.)
- CPC: These are paid ads from places like Facebook, Google, Bing, Amazon, etc. Your business is being charged for that click.
- Referral: This is traffic coming from another site that linked to you. The website is usually listed in the Source
- (direct) \ (none): This is traffic who type in your website directly without using a search engine.
- Email: This is traffic that was sourced from an email your marketing team sent out (or an agency you work with).
- (not set): Google is unable to determine where this traffic came from.
Between your own sales data and metrics from Google Analytics, you may find that a third party isn’t giving you the return you’d hoped for. You can then put the money you invested there in something that does work!
Advanced Analytics Metrics
There are so many different places to find data and learn how users are engaging with your site, where and how they’re converting, and more.
Really, once you feel comfortable in Analytics, jump into the deep end and stay as long as you feel comfortable. You can always head for shallow waters (a.k.a. easier metrics to understand).
Next Steps for Your Analytics Journey
Jumping in and learning more about how people interact with your website is one of the best things you can do to improve how your dealership works for the user. But we get it — Google Analytics can be a time suck you just cannot manage for your already busy position.
Let our team help you understand your analytics better. Schedule a free digital marketing assessment to learn about the ways you can improve your website traffic and overall sales funnel.
Get Your Digital Assessment »
Betsy Sprenkle
As Chief Technical Officer, Betsy loves breaking down barriers and finding creative solutions to problems. An out-of-the-box thinker, Betsy enjoys the opportunities marketing brings because it’s an ever-changing career. When she’s not at the office, you’ll find her in the garden. Learn more about Betsy.